Showing posts with label Calculated Risk. Show all posts

Saturday, January 5, 2013

Calculated Risk — Default Ceiling: Bluffing into the Nuts

I prefer "default ceiling" because "debt ceiling" sounds like some sort of virtuous limit, when, in reality, the vote is about whether or not to the pay the bills - and voting for default is reckless and irresponsible.
Calculated Risk
Default Ceiling: Bluffing into the Nuts
Bill McBride

"Default ceiling." I like it. Excellent framing.
Wednesday, December 19, 2012

Bill McBride — 2013 Housing Forecasts

Towards the end of each year I collect some housing forecasts for the following year. 
Here was a summary of forecasts for 2012. Right now it looks like new home sales will be around 370 thousand this year, and total starts around 770 thousand or so. Tom Lawler, John Burns and David Crowe (NAHB) were all very close on New Home sales for 2012. Lawler was the closest on housing starts.
The table below shows several forecasts for 2013. (several analysts were kind enough to share their forecasts - thanks!)
Calculated Risk
2013 Housing Forecasts
Bill McBride

Sunday, January 8, 2012

Calculated Risk on US Growth for 2012


I took the boring middle ground in 2010 and 2011: sluggish and choppy growth, but no new recession. And once again - for 2012 - I'll take sluggish growth with no recession. There are still plenty of scars from the financial crisis (excessive debt, high unemployment, excess capacity, excess supply of housing, a large number of homeowners with negative equity, and high foreclosure activity), but the economy appears to be slowly healing.
Read it at Calculated Risk
Question #4 for 2012: U.S. Economic Growth

Calculated Risk on Employment in 2012


My guess is private employment will increase around 150 to 200 thousand per month on average in 2012; about the same rate as in 2011.
Read it at Calculated Risk
Question #5 for 2012: Employment

Thursday, December 8, 2011

Household Net Worth declines $2.4 Trillion in Q3 — Calculated Risk


The Federal Reserve released the Q3 2011 Flow of Funds report today: Flow of Funds. 
The Fed estimated that household net worth declined $2.4 trillion in Q3. Household net worth peaked at $66.8 trillion in Q2 2007, and then net worth fell to $50.4 trillion in Q1 2009 (a loss of $16.4 trillion). Household net worth was at $57.4 trillion in Q3 2011 (up $7.0 trillion from the trough, but down $2.4 trillion in Q3).
The Fed estimated that the value of household real estate fell $98 billion to $16.1 trillion in Q3 2011. The value of household real estate has fallen $6.6 trillion from the peak - and is still falling in 2011.
Read the rest at Calculated Risk
Q3 Flow of Funds: Household Net Worth declines $2.4 Trillion in Q3

The US economy is limping along to gradually improving owing to government deficits, but housing remains a major drag.

And it looks like it is not over yet.
Assets prices, as a percent of GDP, have fallen significantly and are only slightly above historical levels. However household mortgage debt, as a percent of GDP, is still historically very high, suggesting more deleveraging ahead for households.

Friday, June 3, 2011

Employment In The Tank

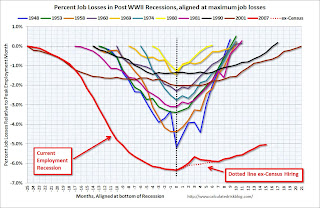
The unemployment numbers just out are pretty dismal. See the analysis of Calculated Risk here and here.

What is particularly concerning though it is the comparison of this recession and recovery with previous ones. Calculated Risk provides a chart.

Image

Washington's Blog notes that the numbers for this recession are actually worse that the Great Depression.


The commonly-accepted unemployment figures for the Great Depression are overstated. Specifically, government workers were counted as unemployed by Stanley Lebergott (the BLS economist who put together the most widely used numbers) ... even though gainfully employed and receiving a pay check...

When the figures are adjusted this recession and recovery is far more serious than it is being made out to be in Washington. Paul Krugman warns that the US is facing a repeat of the double-dip of the Great Depression, when stimulus was removed prematurely in 1937. It took WWII for the US to recover fully — after two decades of underperformance.

With housing double-dipping and the ISM manufacturing index rolling over, things are not looking up. Meanwhile, politicians and pundits are occupied with the pseudo-problem of the deficit and debt and talking austerity as the remedy.

UPDATE: Michael Perelman thinks that a double-dip scenario is overly optimistic. He sees deeper problems resulting in long term malaise until fundamental problems are addressed.


Tuesday, April 19, 2011

Calculated Risk - Residential Investment Recovery

Bill McBride of Calculated Risk offers his Thoughts on Residential Investment Recovery

This is a must-read post. Here is a brief summary:

• Residential investment (RI) is the best leading indicator for the economy. This isn't perfect - nothing is - but RI is usually a strong leading indicator for the business cycle....

• In 2011, residential investment will make a positive contribution to the economy for the first time since 2005....

• ...As the excess supply is absorbed, new residential investment will increase in some areas – and will probably return to normal sometime in 2014 - or as late as 2017 - depending on the actual number of excess vacant housing units. I'm leaning more towards 2015 or 2016...

The housing crisis is still very much with us.