Showing posts with label Emmanuel Saez. Show all posts

Thursday, March 30, 2017

Austin Clemens — The once and future measurement of economic inequality in the United States

A slew of research into economic inequality replete with serious looking graphs may give the impression that measuring inequality in the United States is a solved problem. This is misleading. Inequality is still measured incompletely because existing U.S. government statistics do not attempt to match their estimates to the National Income and Product Accounts. NIPA is the source of the most reported and well-understood economic statistics such as the nation’s Gross Domestic Product and quarterly GDP growth figures.
Because existing estimates of economic inequality are not pegged to NIPA, they don’t account for all sources of income. They may exclude, for example, fringe benefits provided by employers such as employer-provided health insurance and retirement benefits, government transfers such as supplemental nutrition assistance or the child tax credit, government services such as public education, and tax expenditures such as the home mortgage tax deduction and tax breaks for employer-provided insurance. These exclusions, big and small, make many existing estimates of inequality fundamentally incomparable to our most well-established measures of economic growth....
Important analysis from the POV of stock-flow consistency follows. Efforts are underway to improve measurement to bring estimates of income in line with national income accounting in order to remove the inconsistencies arrive at a better understanding of income and wealth distribution in the US.
The ability to look at the geographic distribution of inequality and at slices of income within different income groups teases the possibilities of a more robust project to disaggregate the National Income and Product Accounts statistics that are currently the most referenced statistics of economic progress in the nation. Devoting federal resources to the project could allow us to track inequality not only by income bands, but also by age, geographic location, gender, ethnicity, and type of income.
WCEG — The Equitablog
The once and future measurement of economic inequality in the United States
Austin Clemens

Monday, January 2, 2017

Steve Roth — How Do Americans Get Rich? (And Stay Rich?)


Wealth is generally conceived as a stock that is increased by the flow of income. But some wealth grows by itself, for example, equity prices based on market cap and real estate based on land rent. While interest is considered a type of income and is booked periodically (and is taxable in the period), asset appreciation that increases wealth is not considered income but capital gains and it is not booked (or taxed) until it is realized  even though it results in actual wealth accrual. Steve Roth poses some questions about this.
A huge aid to answering that question arrived last month. Gabriel Zucman, Emmanuel Saez, and Thomas Piketty (PSZ) released one of the most important pieces of economic research in the last century. Their Distributional National Accounts (DINAs) reveal the distribution of national income to different income classes, wealth classes, age groups, and genders (and potentially different races, etc. etc.). This has been unavailable in the national accounts, and as a result it’s absent in most macroeconomic empirical work.…
But impressive as they are, the DINAs don’t fully answer the question of how Americans accumulate wealth. Because the DINAs only tally income, and income doesn’t include households’ holding (or “capital”) gains on stock portfolios, real estate, etc. Income does include much “property income” — dividends, interest, etc. That’s income from owning things. But it’s not everything that households receive from ownership. Holding gains figure large in that picture.
Any investor will tell you: cap gains are a big part of their wealth accumulation. Total return — dividends plus capital gains — is the measure that most savvy stock-market investors care about, long-term (and that fund managers like to tout, loudly). And much of Americans’ retirement saving — especially middle-class Americans — is accrued through capital gains on their homes.
The DINAs’ central goal is to match income as presented in the national accounts, and to reveal a multidimensional pyramid of distributional data underneath that income measure. A deeply worthy goal. But as a result, the DINAs can’t and don’t reveal the whole picture of household wealth accumulation (change in assets and net worth), or its distribution.…
Wealth accumulation greatly exceeds saving from income, pretty much always and everywhere, over very long periods. And holding gains are not a small part of wealth accumulation, especially for already-wealthy households....
Evonomics
How Do Americans Get Rich? (And Stay Rich?)
Steve Roth | Publisher of EvonomicsSae

Monday, October 27, 2014

Emmanuel Saez and Gabriel Zucman — Exploding wealth inequality in the United States

Wealth inequality in the US has followed a U-shaped evolution over the last century – there was a substantial democratisation of wealth from the Great Depression to the late 1970s, followed by a sharp rise in wealth inequality. This column discusses new evidence on the concentration of wealth in the US. Growing wealth disparity is fuelled by increases in both income and saving rate inequalities between the haves and the have nots.… 
How can we explain the growing disparity in American wealth? The answer is that the combination of higher income inequality alongside a growing disparity in the ability to save for most Americans is fuelling the explosion in wealth inequality. For the bottom 90% of families, real wage gains (after factoring in inflation) were very limited over the past three decades, but for their counterparts in the top 1% real wages grew fast. In addition, the saving rate of middle-class and lower-class families collapsed over the same period while it remained substantial at the top. Today, the top 1% families save about 35% of their income, while the bottom 90% families save about zero (Saez and Zucman 2014).
If income inequality stays high and if the saving rate of the bottom 90% of families remains low then wealth disparity will keep increasing. Ten or 20 years from now, all the gains in wealth democratisation achieved during the New Deal and the post-war decades could be lost. While the rich would be extremely rich, ordinary families would own next to nothing, with debts almost as high as their assets.…
What should be done to avoid this dystopian future? We need policies that reduce the concentration of wealth, prevent the transformation of self-made wealth into inherited fortunes, and encourage savings among the middle class.…
Vox.eu
Exploding wealth inequality in the United States
Emmanuel Saez, Professor of Economics and Director of the Center for Equitable Growth, University of California Berkeley, and Gabriel Zucman, Assistant professor of economics, London School of Economics

Tuesday, October 21, 2014

Mark Gongloff — All The Wealth The Middle Class Accumulated After 1940 Is Gone


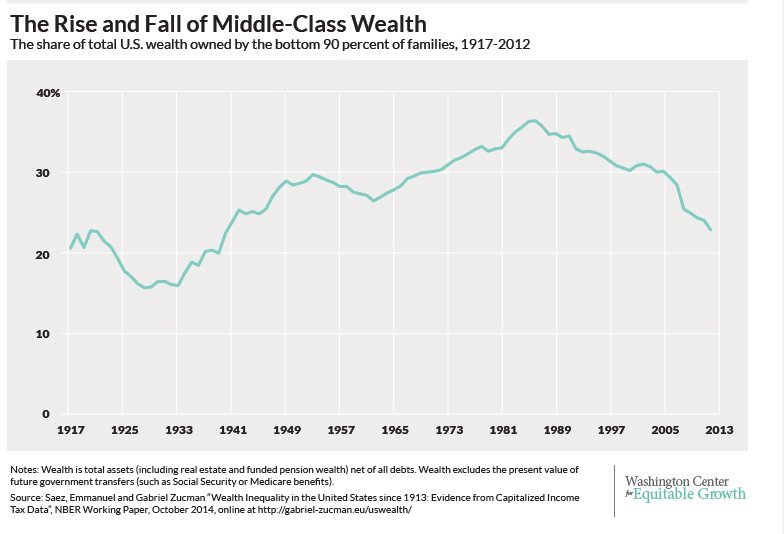
The middle-class share of American wealth has been shrinking for the better part of three decades and recently fell to its lowest level since 1940, according to a new studyby economists Emmanuel Saez of the University of California, Berkeley, and Gabriel Zucman of the London School of Economics….
In this case, "middle class" is defined rather expansively as the bottom 90 percent of all Americans. "Wealth" is the total of home equity, stock and bond holdings, pension plans and other assets, minus debt. As such assets are mostly owned by mid- to higher-income households -- and considering most Americans define themselves as "middle-class" -- it seems reasonable to use the bottom 90 percent as a proxy for the "middle class."…
Debt has been the big force driving net wealth lower for the middle class, according to Saez and Zucman. Brief bubbles in stock and home prices in the 1990s and 2000s only temporarily offset the steady, depressing rise in mortgage, student-loan, credit-card and other debts for the bottom 90 percent.
The Huffington Post
All The Wealth The Middle Class Accumulated After 1940 Is Gone
Mark Gongloff

Tuesday, August 26, 2014

masaccio — Studies Confirm Huge Wealth Loss of Middle Class


Firedoglake
Studies Confirm Huge Wealth Loss of Middle Class
masaccio
The trend lines are clear. The Oligopoly will get richer. The middle class will disappear in a few years. 
Politicians don’t care. The Republicans are ecstatic: it shows that markets are working and heavily rewarding the most moral and superior among us. The Democrats don’t care. They’re happy to talk about income inequality, but they can’t bring themselves to mention the growing Oligarchy, the vanishing middle class, or the sickening poverty of the bottom 24 million households.

Saturday, April 12, 2014

Huffington Post — The Super Rich Are Richer Than We Thought, Hiding Huge Sums, New Reports Find

A new pair of reports suggests that the super rich are richer than we thought.
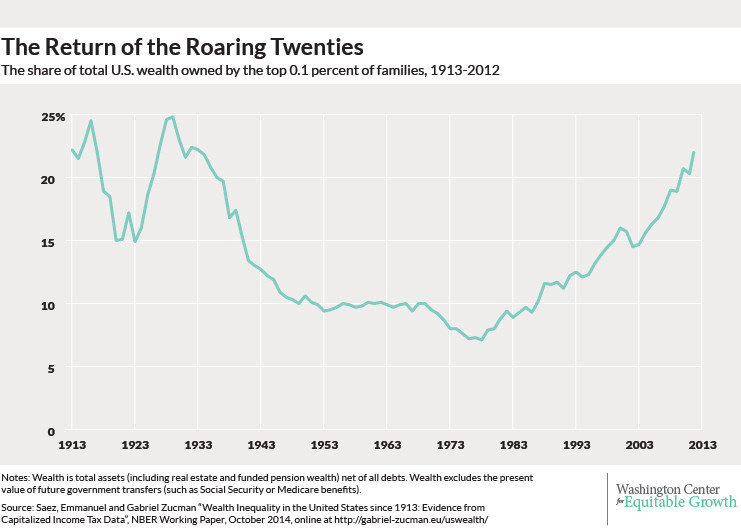
The first report by Professors Emmanuel Saez (UC Berkeley) and Gabriel Zucman (LSE and UC Berkeley) addresses the question of how to measure total wealth, finding that there is an increasing concentration in the top one-thousandth.
So where is all this wealth going? The second report, by Zucman, demonstrates that a lot of the money is held in offshore tax havens -- far more than previously known.
The Huffington Post
The Super Rich Are Richer Than We Thought, Hiding Huge Sums, New Reports Find

Brad DeLong — A Few Finger Exercises with the Saez and Zucman Wealth-Concentration Estimates…


WCEG — The Equitablog
A Few Finger Exercises with the Saez and Zucman Wealth-Concentration Estimates…
Brad DeLong


Monday, April 7, 2014

JW Mason — Wealth Distribution and the Puzzle of Germany

There’s been some discussion recently of the new estimates from Emmanuel Saez and Gabriel Zucman of the distribution of household wealth in the US. Using the capital income reported in the tax data, and applying appropriate rates of return to different kinds of assets, they are able to estimate the distribution of household wealth holdings going back to the beginning of the income tax in 1913. They find that wealth inequality is back to the levels of the 1920s, with 40% of net worth accounted for the richest one percent of households. The bottom 50% of households have a net worth of zero.
There’s a natural reaction to see this as posing the same kind of problem as the distribution of income — only more extreme — and respond with proposals to redistribute wealth. This case is argued by the very smart Steve Roth in comments here and on his own blog. But I’m not convinced. It’s worth recalling that proposals for broadening the ranks of property-owners are more likely to come from the right. What else was Bush’s “ownership society”? Social Security privatization, if he’d been able it pull it off, would have dramatically broadened the distribution of wealth. In general, I think the distribution of wealth has a more ambiguous relationship than the distribution of income to broader social inequality.
Last summer, the ECB released a survey of European household wealth. And unexpectedly, the Germans turned out to be among the poorest people in Europe. The median German household reported net worth of just €50,000, compared with €100,000 in Greece, €110,000 in France, and €180,000 in Spain. The pattern is essentially the same if you look at assets rather than net worth — median household assets are lower in Germany than almost anywhere else in Europe, including the crisis countries of the Mediterranean.
At the time, this finding was mostly received in terms the familiar North-South morality tale, as one more argument for forcing austerity on the shiftless South. Not only are the thrifty Germans being asked to bail out the wastrel Mediterraneans, now it turns out the Southerners are actually richer? Why can't they take responsibility for their own debts? No more bailouts!
No surprise there. But how do we make sense of the results themselves, given what we know about the economies of Germany and the rest of Europe? I think that understood correctly, they speak directly to the political implications of wealth distribution....
Resolving paradoxes of income and wealth. A lot of analysis depends on the construction on which it is based.
The question is, what is the relationship between the level of market production in an economy, and the claims on future production represented by wealth? It’s a truism — tho often forgotten — that the market production counted in GDP is only a part of all the productive activity that takes place in society. In the same way, not all market production is capitalized into assets. Wealth in an economic sense represents only those claims on future income that are exercised by virtue of a legal title that is freely transferable, and hence has a market value.
For example, imagine two otherwise similar countries, one of which makes provision for retirement income through a pay-as-you-go public pension system, and the other of which uses some form of funded pension. The two countries may have identical levels of output and income, and retirees may receive exactly the same payments in both. But because the assets held by the pension funds show up on balance sheets while the right to future public pension payments does not, the first country will have less wealth than the second one. Again, this does not imply any difference in production, or income, or who ultimately bears the cost of supporting retirees; it is simply a question of how much of those future payments are capitalized into assets.
The Slack Wire
Wealth Distribution and the Puzzle of GermanyJW Mason