Wolf Street
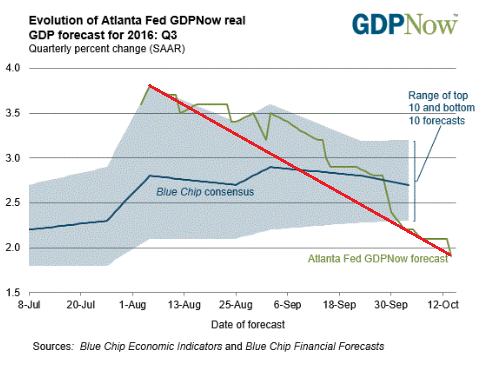
The Amazing Down Spiral of Atlanta Fed’s Q3 GDPNow Forecast
Wolf Richter
An economics, investment, trading and policy blog with a focus on Modern Monetary Theory (MMT). We seek the truth, avoid the mainstream and are virulently anti-neoliberalism.
Showing posts with label US GDP. Show all posts
Saturday, October 15, 2016
Tuesday, April 21, 2015
Jeff Cox — Wall Street's mystery: Where's all the economic growth?
The reason why the U.S. economy is so susceptible to dollar strength and other obstacles may be that the post-financial crisis recovery isn't really what it's cracked up to be.
That's the emerging view from Wall Street consensus coupled with economic data that suggest the long-awaited V-shaped rebound has yet to take hold.…
Citi's Lee puts much of the blame on U.S. dollar strength for the economic weakness. The greenback has surged more than 22 percent over the past year against a trade-weighted basket of its global competitors.
In total, Lee sees currency headwinds shaving as much as 1.25 percentage points off domestic growth, and more generally speaking believes the factor is not appreciated enough by economists and strategists trying to parse out what is ailing the U.S. this year.
Lee also said the current state of the job market is a problem. Employment growth "has been too slow," he said, and concentrated in low-wage sectors to the point where workers in the 1970s were making more than those today when using inflation-adjusted figures."It's the demand, stupid."
"With so many low-wage jobs created, there may not be sufficient income growth to boost demand and GDP growth beyond the current tepid pace," he wrote.…
CNBC NetNet
Wall Street's mystery: Where's all the economic growth?
Jeff Cox
Wednesday, July 30, 2014
Bill McBride — GDP: A Few Graphs
Overall this was a solid report. Private investment rebounded in Q2, and that is the key to more growth going forward.Calculated Risk
GDP: A Few Graphs
Bill McBride
Wednesday, September 7, 2011
This picture pretty much resolves the Keynes vs. Austrian debate
Hat tip to Ralph Musgrave for this chart. He had it on his blog, but I cleaned it up.
Anyway, my intent was to show some perspective. I think that's always useful. We hear a lot about how Keynesian economics doesn't work and about how the world was better under the gold standard.
I think the chart below goes a long way toward resolving that debate. It plots annual changes in U.S. real GDP going back to 1860. Take a look at how many deep recessions and depressions the country experienced in the 19th century. Pretty much, every 10 years, a depression! And the swings in GDP were huge!
Compare that to the mid 20th century and especially 1971 forward. What a contrast! Very few recessions and no depressions. And even the recessions have been much milder, current one being an exception.
Remember that the U.S. was on a gold standard until 1933 (domestically) and completely off the gold standard and on a system of floating FX non-convertibility from 1971 on. Rather than get worse, things stabilized immensely.
All the recent troubles can be traced back to Clinton's surpluses, which essentially was the equivalent of putting us on a gold standard. The rebound out of the recent "Lesser Depression" was due to massive deficit spending. Did I hear someone say Keynes??
Subscribe to:
Posts (Atom)